Root cause: what it is and why you need to find it fast
Discover how to identify the origin of an incident and speed up its resolution
When an application fails or starts performing worse, the first things that usually appear are the consequences: errors, increased latency, requests taking longer than usual, or users unable to complete an action.
But those symptoms don’t always indicate where the problem actually lies.
In a modern cloud infrastructure, an incident can involve multiple services. That’s why detecting that something is failing is only the first step. The real challenge is finding what’s causing it.
That’s where root cause comes into play.
What is the root cause of an incident?
The root cause is the origin of a problem that triggers a series of events or errors within a system or software.
It doesn’t always match the first symptom we detect.
For example, an application may start responding slowly and generate hundreds of alerts. At first glance, we might think the problem lies in the service with the highest latency.
However, by analyzing the full journey of a request, we can discover that the origin lies in a specific dependency, a database query, a recent change, or a service causing a chain reaction.
That’s why it’s important to differentiate between:
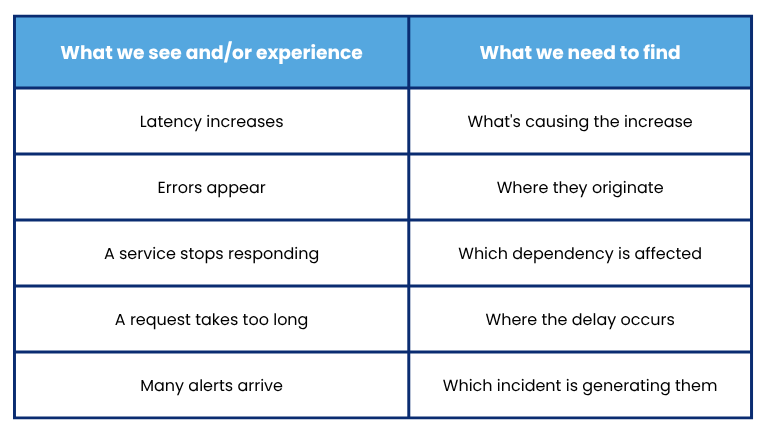
The difference lies in moving from symptom to origin.
The problem with investigating an incident manually
During an incident, every minute counts.
The problem is that, in distributed architectures, finding the root cause may require reviewing different dashboards, logs, metrics, and traces, cross-referencing information between tools, and manually reconstructing what happened.
Meanwhile, the impact can continue to grow.
When all this information is scattered, diagnosis can become a long and complex process.
Traces let you follow the problem back to its origin
This is where traces become especially important.
A trace allows you to follow the journey of a request through the different services involved in it. Instead of analyzing each component in isolation, it lets you understand what happens throughout the entire journey.
This is especially useful when an application depends on multiple microservices, APIs, or external systems.
For example, a request might follow this path:
User → API → authentication service → microservice → database → external service
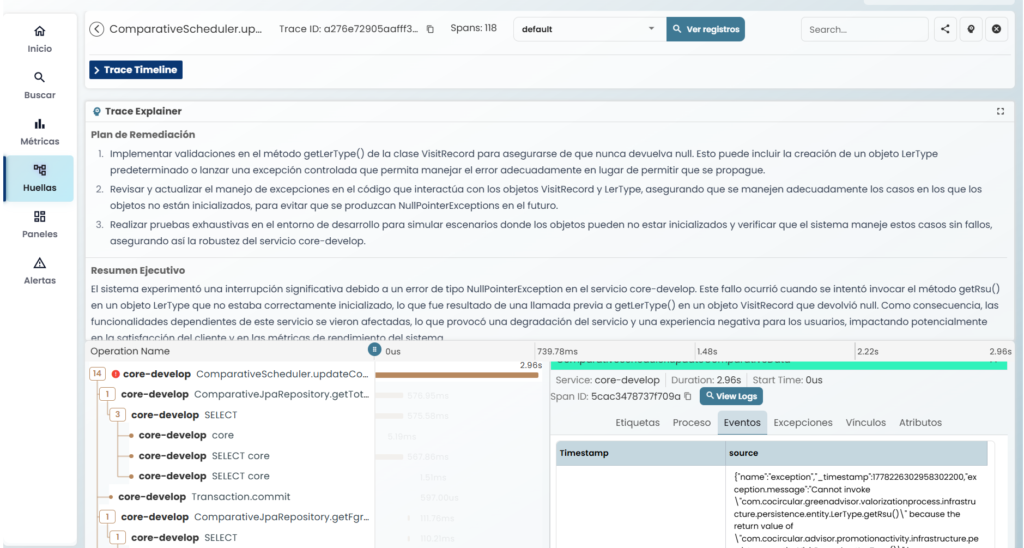
If the response takes 5 seconds, knowing that the application takes 5 seconds doesn’t explain the problem.
The trace lets you identify where those 5 seconds are concentrated and which component may be behind the degradation.
And the more complex the architecture, the more valuable it is to be able to visualize that journey.
From analyzing a trace for hours to understanding it in seconds
Observability provides the data needed to investigate an incident, but the amount of information generated by today’s systems makes analyzing it manually a challenge.
This is where AI applied to traces can change the process.
At Lessthan3, our Trace Explainer feature uses AI to analyze a trace and explain in simple terms what’s happening.
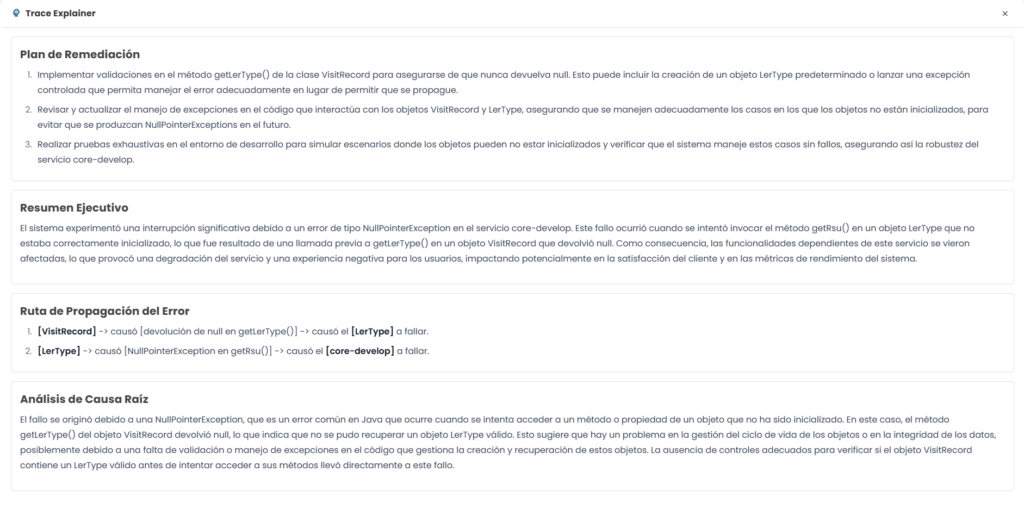
Instead of forcing the team to manually review every element of the trace, Trace Explainer identifies the origin of the problem, summarizes what happened, and provides context to understand what’s going on.
The goal is simple: to reduce the time teams need to go from a trace to a useful explanation in natural language.
A practical example
Imagine an e-commerce site where some users start experiencing problems during the checkout process.
Metrics show increased latency and errors appear across different services. From there, the team might start reviewing logs, dashboards, and alerts to try to find the origin.
But a single incident can generate many different signals.
With observability and traces, the team can follow the journey of affected requests and pinpoint where the degradation begins.
And with Trace Explainer, AI can analyze that trace and provide a summary of the problem, helping to quickly identify the root cause and providing information about what to review.
What once could require hours of manual investigation can become an explanation available in seconds.
Root cause ≠ first alert
One of the most important ideas when we talk about observability is that the first alert doesn’t have to be the cause of the problem.
An incident can trigger a chain of events:
A service degrades → latency increases → errors appear → other dependencies start failing → multiple alerts are generated.
If we only analyze the final alerts, we may end up investigating the consequences instead of the origin.
Observability allows us to connect those signals, and traces help reconstruct the journey of a request.
AI adds another layer: helping to interpret all that information and turn it into actionable context.
Less time investigating, more time resolving
Finding the root cause quickly doesn’t just improve diagnosis. It also changes the way teams work.
A faster resolution process can help to:
- Reduce MTTR.
- Decrease time spent on manual investigation.
- Prevent teams from working on incorrect hypotheses.
- Better understand the impact of an incident.
- Make decisions with more context.
- Resolve problems before their impact grows.
The point isn’t simply detecting an incident sooner.
It’s understanding sooner what’s happening so you can act better.
How Lessthan3 helps you find the root cause
Finding the root cause of an incident requires connecting different signals and understanding what’s happening inside the infrastructure. The Lessthan3 platform brings together metrics, logs, events, and traces in a single observability environment to facilitate that analysis.
In the case of traces, Trace Explainer uses artificial intelligence to analyze what happened and explain the origin of the problem in seconds. Instead of manually reviewing every step of a trace, teams can get a summary of what occurred, identify where the problem lies, and know what aspects they should review.
This allows them to move from an investigation based on scattered data to a clearer view of the incident, reducing time spent on diagnosis and enabling a faster response.
Finding the root cause sooner not only allows you to resolve an incident faster—it also helps teams better understand what’s happening in their infrastructure and make decisions with more context.