Why is your application slow? 6 causes that a complex infrastructure can hide
Discover what might be behind a slow application
At first glance, a slow application seems like a straightforward problem to identify. For example, when a user notices a page taking too long to load, a system request responding with delays, or a process that used to run in seconds now taking significantly longer.
But in modern cloud infrastructures, pinpointing the root cause of that slowness can be far more complicated.
An application can depend on dozens of services, APIs, databases, containers, or external providers. A single request may travel through many components before reaching the user.
That’s why, when a performance issue arises, the component where we observe the problem isn’t necessarily the one causing it.
The key is understanding what happens across the entire path of a request and how applications and services interact with one another.
1. Insufficient or poorly sized resources
CPU, memory, storage, or network capacity can become bottlenecks when traffic increases or user behavior changes.
But it’s not simply a matter of adding more capacity. It could also be that enough resources exist and the problem lies elsewhere.
Understanding how resources are being used and which component is limiting performance is the first step.
2. A database that has become the bottleneck
An application may function correctly yet still deliver a slow experience because database queries are taking too long.
Inefficient queries, increased data volume, or connection saturation can end up affecting the performance of the entire application.
From the outside, it may just look like “the application is slow,” when the root cause lies in another component.
3. An API or external service responding too slowly
Applications increasingly rely on other external services: payments, authentication, APIs, cloud providers, and various specialized services.
If one of them starts responding more slowly, the delay can cascade into the entire user experience.
That’s why it’s important to have visibility into dependencies and to quickly distinguish between internal and external issues.
4. A recent change has altered system behavior
Not all performance issues appear because something has broken.
A new deployment, a configuration change, an update, or an architectural shift can alter how a service behaves.
A key question when performance degrades is:
What changed right before the problem started?
Correlating changes with metrics, logs, and traces can help uncover connections that would go unnoticed if each piece of information were analyzed in isolation.
5. The system is scaling—but not where it should
Auto-scaling is one of the great advantages of the cloud, but adding resources doesn’t always solve a performance problem.
Imagine a service receives a sudden spike in traffic and begins to scale. Available capacity increases, but another component of the system cannot handle that additional load.
The result can be a chain reaction:
more traffic → more resources → more requests → greater saturation elsewhere → worse performance.
That’s why it’s essential to analyze the behavior of the entire infrastructure, not just the service that is scaling.
6. The problem isn’t in a single component
This is one of the most difficult situations to diagnose.
In a distributed infrastructure, a slow application can be the result of several small issues occurring simultaneously.
For example:
An API starts responding more slowly, connections increase, a database becomes saturated, and errors begin to appear.
Analyzed separately, these events may seem unrelated.
But when correlated, they can explain exactly what is happening.
What signals can indicate that something is wrong?
When an application loses performance, certain signals can help pinpoint where to start looking.
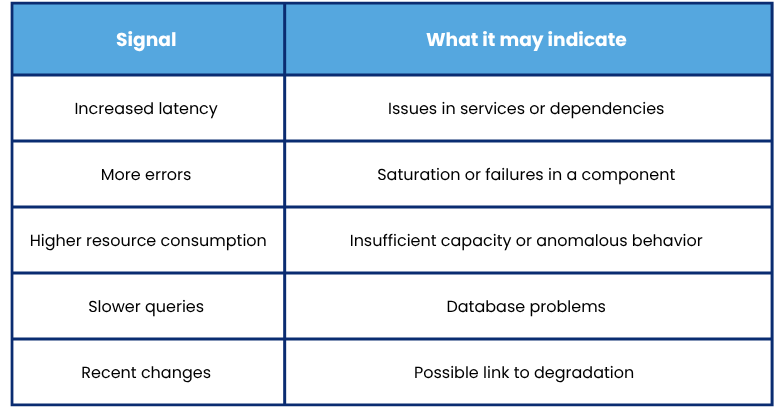
But analyzing each signal in isolation isn’t always enough.
What matters is understanding how they relate to one another.
Observability helps find the root cause
Advanced observability brings together metrics, logs, and traces to build a more complete view of the system.
Metrics show what is changing, logs provide information about events, and traces allow you to follow a request’s journey across different services.
By connecting all this information, you can go from:
“The application is slow.” to understanding which component is causing the delay and how it’s affecting the rest of the system.
What does artificial intelligence bring to the table?
When infrastructures generate millions of data points, manual analysis is no longer an efficient option.
AI applied to observability enables continuous analysis of large volumes of information to detect patterns, anomalies, and relationships between different events.
For example, it can help identify that a degradation began after a change, or that several seemingly unrelated alerts are actually part of the same incident.
The goal isn’t to have more data—it’s to understand it faster.
How Lessthan3 can help
At Lessthan3, we help companies understand what’s really happening inside their cloud infrastructures.
Our platform brings together metrics, logs, traces, and events in a single environment and uses observability and artificial intelligence to detect anomalies, correlate information, and make it easier to identify the root cause of issues.
This allows teams to move from analyzing isolated signals to having a complete view of their systems’ behavior—and full control over them.
Because when an application runs slow, knowing there’s a problem is just the beginning. The key is understanding why—so you can solve it efficiently.