What is a trace and why monitor it?
How to understand the journey of requests through your systems and stay in control complex architectures
In our previous article, we discussed how to reduce MTTR with artificial intelligence and a problem that appears in almost every modern cloud environment: when something fails, the real challenge isn’t fixing it quickly- it’s understanding what’s actually happening inside the system.
In distributed architectures, with microservices, APIs, and multiple dependencies, a single user action can travel through dozens of different services. And when you lack visibility into that journey, diagnosing a problem becomes a slow, guesswork-driven- process.
This is where traces come in- one of the pillars of modern observability.
What is a trace (no overcomplication)?
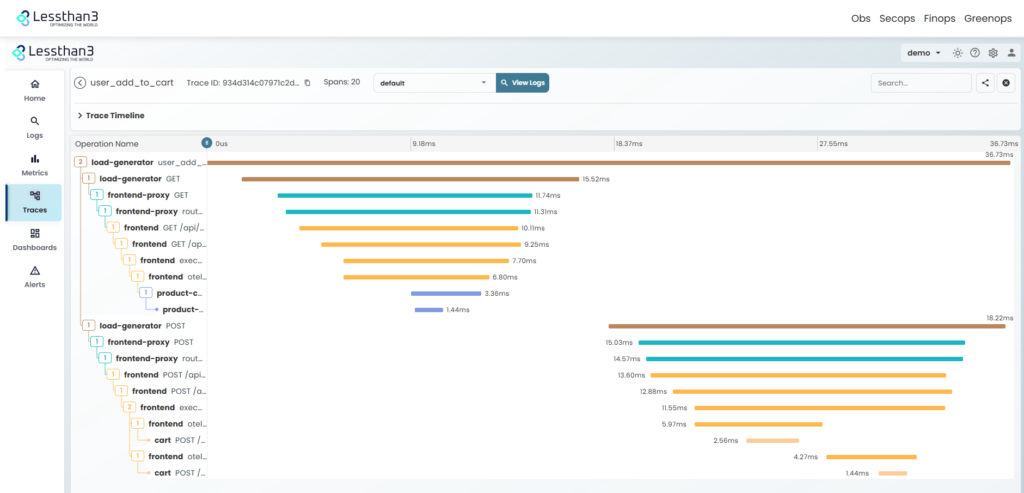
A trace is the complete record of the path a request follows through a distributed system.
For example: a user visits a website, logs in, adds a product to their cart, and completes a purchase.
Behind this process, the system may interact with multiple components: an authentication service, a catalog API, a payment service, databases, an inventory system, external services and more.
A trace lets you see that entire journey from start to finish- like a “map” of the request’s actual flow through the system.
Each step in that journey is called a “span,” and together they form the complete story of what happened.
Why traces are critical in modern cloud environments
The problem in today’s architectures isn’t that failures occur, it’s that there are many points where they can occur.
For example, when the application is slow, intermittent errors appear, or certain services stop responding, the cause could be any number of issues at very specific points.
With traces, you see exactly where: which specific service is failing, at what point in the flow latency occurs, which dependency is causing the problem, how the error propagates between services…
This completely changes the way you work: you go from “searching” to “clearly seeing.”
Metrics, logs, and traces: How they complement each other
To truly understand the value of traces, you need to see them within the observability ecosystem:
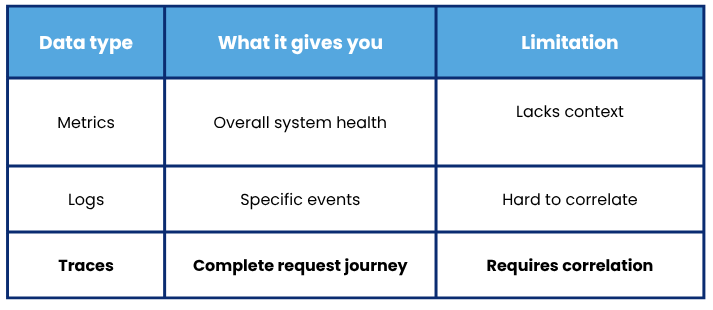
Traces are what connects everything else. Without them, you have isolated pieces. With them, you have the complete narrative.
Where production problems really start?
There’s an important point that often gets overlooked: production problems rarely come from a single point.
They usually come from: small latencies that accumulate between services, non-obvious dependencies, external calls that are slower than expected, errors that only appear under high loads…
And without traces, all of this is practically invisible until the impact is already severe.
What changes when you start using traces correctly
When traces are properly implemented, the change isn’t just technical- it’s also operational:
- Teams stop “trying things” and start seeing the real flow.
- Diagnosis time is reduced (critical for MTTR).
- Dependencies between services become much clearer.
This connects directly to what we saw in the previous article: less time understanding the problem = lower MTTR.
How Lessthan3 helps
At Lessthan3, traces are not analyzed in isolation, but as part of a complete view of the technology system or application in question.
Our platform lets you analyze traces in real time, correlate them with metrics and logs, automatically detect anomalous patterns, and anticipate incidents before they impact production and the business.
The goal isn’t just to see what happened- it’s to understand why it happened and what impact it has on the rest of the system.
Conclusion
Traces have become pieces of any modern cloud architecture. They don’t just let you see the journey of a request- they help you understand how all the components of a distributed system interact.
In today’s environment, where complexity is constantly growing, that’s key to staying in control.
As with the MTTR metric, the better you understand what’s happening inside your infrastructure, the faster you can react, fix, and even prevent failures.
And traces are exactly that: the most direct way to stop working blindly and start seeing your system for what it truly is.